


Life has lessons for investing.
As new parents with twin infants as our first children, my wife and I learned quickly that consistency in our routines paid dividends. The more consistent we were with the feeding and napping schedule during the day, the better we all slept at night. Research supports the idea that babies crave consistency.
“Doing certain things in the same order at about the same time every day helps strengthen brain connections and builds the baby's confidence” because they know what to expect in a situation. “A child also learns to be more self-sufficient when the routine is the same every day” because they can anticipate what comes next.1
Adults also tend to crave structure and consistency.
One of the major challenges of the pandemic involved losing our comfortable routines around daily living. It was difficult, if not impossible, to find consistency during Covid because we were living in uncharted territory. Even today, as investors, it is easy to feel we are in uncharted territory as we are bombarded with headline risk from our always-on news cycle.
Consistency may make us better investors
Behavioral finance research also underscores the importance of consistency for investors. Consider “loss aversion,” which explains that “the pain of losing is psychologically about twice as powerful as the pleasure of gaining.”2 Some may conclude mitigating the frequency and intensity of losses may help investors have more pleasurable experiences when investing. Comparing the consistency of investments may be a valuable tool for investors seeking to dampen the impact of loss aversion.
“Comparing the consistency of investments may be a valuable tool for investors seeking to dampen the impact of loss aversion.”
Popular investment analysis tends to rank investments over the most recent 1-, 3-, 5-, and 10-year periods as of the most recent quarter-end. Since retirement plan investors are investing money to last the rest of their lives, why analyze one time period when you can analyze all time periods since the inception of an investment, or for the tenure of the current manager? For example, an investment with 10 years of history as of December 31, 2022, allows you to measure one 5-year period ending December 31, 2022, or 24 rolling 5-year periods on a quarterly basis dating back to a hypothetical January 2013 inception date. This “all-period” calculation is known as rolling-period analysis.
Applying rolling-period analysis
To better understand the value of screening for consistency via rolling-period analysis, let’s look at Putnam Large Cap Growth Fund. For the 5-year period ended September 30, 2023, the fund was ranked in the top 14th percentile among its Large Growth peers by Morningstar.3 Since one 5-year period tells us little about consistency, when we broaden the time horizon to 18 rolling 5-year month-end periods (covering the tenure of the current management team), we note the fund ranked in the top quartile of its peer group for every rolling 5-year period since 2021. (Please read "Investing for consistency through durable growth themes" for documentation of the results noted above and to learn about the approach employed by the fund’s managers.)
The fund has consistently ranked in the top quartile of its peer group
Morningstar percentile rankings for rolling 5-year month-end periods
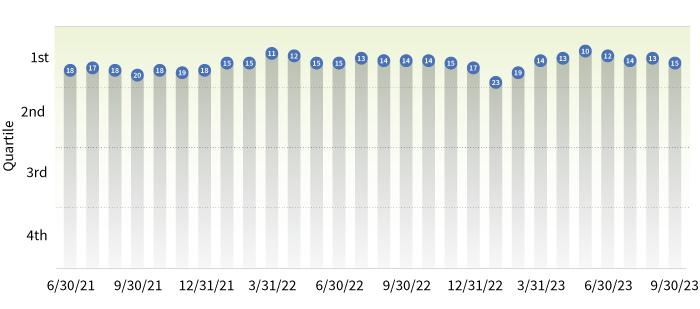
Source: Morningstar.
“One 5-year period tells us little about consistency.”
Why would a long-term retirement investor use one 5-year period when there are 18 available? It has been said, using one period instead of multiple periods is like using an X-ray to diagnose a serious medical challenge rather than employing a CT scan or MRI. If your health is at stake, which would you choose?
Similar results are found when analyzing Putnam Large Cap Value Fund. For the most recent 5-year period ended September 30, 2023, the fund was ranked in the top 7th percentile among its Large Value peers by Morningstar.4 Broadening the time horizon to the 21 rolling 5-year quarter-end periods (covering the tenure of the current management team), we note the fund has ranked in the top quartile for every rolling 5-year period since 2018. (Documentation of these results can be found in "Investing for consistency in all markets.")
The fund has consistently ranked in the top quartile
Morningstar percentile rankings for rolling 5-year periods
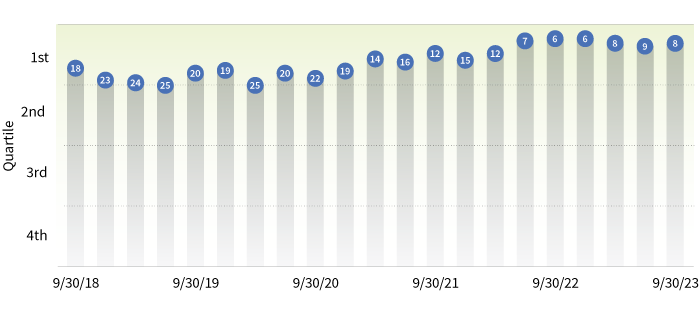
Source: Morningstar.
Target-date funds require more detailed analysis
Using vintage rankings for target-date funds can be complicated. Asset managers employ a variety of glide path approaches that cause differences in asset allocation within vintages. Rolling-period analysis across vintages with widely different allocations may create an “apples to oranges” comparison.
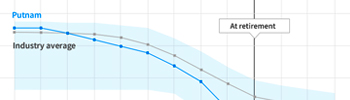
We found three measures that are helpful for target-date analysis. Up-capture ratios illuminate the effectiveness of target-date vintages far from retirement. Down-capture ratios work well for vintages near retirement. And drawdown analysis provides an additional consistency screen for vintages closest to retirement.
“Our strategies nearest retirement consistently delivered better downside protection in market drawdowns.”
Using this methodology, Putnam Retirement Advantage 2055 Trust, a far-from retirement vintage, has both a performance and up-capture advantage compared with its Morningstar category average. Similarly, the close-to-retirement 2025 vintage has a standard deviation and down-capture advantage over its Morningstar peer group. Further, our strategies nearest retirement consistently delivered better downside protection in market drawdowns. These statistics illustrate what we mean when we say our glide path is built to take the right risk at the right time. Please visit "Targeting the right risk at the right time" for documentation of the points made above.
Conclusion
In life and in investing, people are wired to crave consistency. When investing, a way to screen for consistency is using rolling-period analysis. For target-date funds, the search for consistency depends on what section of the glide path is being examined. Using the methodologies described here may help you find investments that meet the consistency goals of your retirement plan clients.
1 University of Georgia, “Creating Consistency,” Circular 1053-11, December 2022, https://secure.caes.uga.edu/extension/publications/files/pdf/C%201053-11_4.PDF.
2 BehavioralEconomics.com, “Loss aversion,” April 2015, https://www.behavioraleconomics.com/resources/mini-encyclopedia-of-be/loss-aversion/.
3 Putnam Large Cap Growth Fund fact sheet, class R6, October 2023, https://www.putnam.com/literature/pdf/FS116_R6.pdf.
4 Putnam Large Cap Value Fund fact sheet, class R6, October 2023, https://www.putnam.com/literature/pdf/FS28_R6.pdf.
335538
For informational purposes only. Not an investment recommendation.
This material is provided for limited purposes. It is not intended as an offer or solicitation for the purchase or sale of any financial instrument, or any Putnam product or strategy. References to specific asset classes and financial markets are for illustrative purposes only and are not intended to be, and should not be interpreted as, recommendations or investment advice. The opinions expressed in this article represent the current, good-faith views of the author(s) at the time of publication. The views are provided for informational purposes only and are subject to change. This material does not take into account any investor’s particular investment objectives, strategies, tax status, or investment horizon. Investors should consult a financial advisor for advice suited to their individual financial needs. Putnam Investments cannot guarantee the accuracy or completeness of any statements or data contained in the article. Predictions, opinions, and other information contained in this article are subject to change. Any forward-looking statements speak only as of the date they are made, and Putnam assumes no duty to update them. Forward-looking statements are subject to numerous assumptions, risks, and uncertainties. Actual results could differ materially from those anticipated. Past performance is not a guarantee of future results. As with any investment, there is a potential for profit as well as the possibility of loss.
Diversification does not guarantee a profit or ensure against loss. It is possible to lose money in a diversified portfolio.
Consider these risks before investing: International investing involves certain risks, such as currency fluctuations, economic instability, and political developments. Investments in small and/or midsize companies increase the risk of greater price fluctuations. Bond investments are subject to interest-rate risk, which means the prices of the fund’s bond investments are likely to fall if interest rates rise. Bond investments also are subject to credit risk, which is the risk that the issuer of the bond may default on payment of interest or principal. Interest-rate risk is generally greater for longer-term bonds, and credit risk is generally greater for below-investment-grade bonds, which may be considered speculative. Unlike bonds, funds that invest in bonds have ongoing fees and expenses. Lower-rated bonds may offer higher yields in return for more risk. Funds that invest in government securities are not guaranteed. Mortgage-backed securities are subject to prepayment risk. Commodities involve the risks of changes in market, political, regulatory, and natural conditions. You can lose money by investing in a mutual fund.
Putnam Retail Management.